Card Sort for CDC Public Health Portal
Organizing an application can be difficult.
To prevent user confusion and to improve user interaction, as a UX researcher, I can provide information architecture recommendations from users using use case interviews and card sort research initiatives.
Project Scope
Goals: Understand how public health orgs would intuitively navigate a data sending Portal
Client: Center of Disease Control and Prevention (CDC)
Method: Card sort, interviews, focus groups
Duration: 6 weeks
Participants: 5 public health data producer and tech company teams
Recruitment: Email volunteer existing users
Tools: Optimal Workshop, Miro, MS Teams, Dovetail
Background
Public health agencies and the general public need to know accurate data on immunizations, cases, and other associated data on various diseases, viruses, and disorders. The CDC needs to collect the data the data from many sources so that they can analyze the data and disseminate statuses.
I conducted a card sort and user interview initiative to identify how organizations and tech companies who send public health data to the CDC would best organize various components and features planned to appear in the Portal.
Recruitment
I interviewed 5 teams:
4 public health data producer organizations
1 public health tech company
I recruited the teams by an existing email list provided by the Portal host-company.
I was required to abide by the Paperwork Reduction Act regulations limiting my user participant count to nine participants total.
Research Questions
Use Case:
What is the customer’s organization like? What industry and public health domain does the company represent?
How have the customer sent data to the CDC prior (if they have)
What pain points does the customer have in sending public health data
Card Sort:
How would the customer organize the Portal’s features?
Asked users to describe what they believed the feature means and would look like on Portal
Cards
I broke the portal features into 20 features for participants to sort:
Analysis
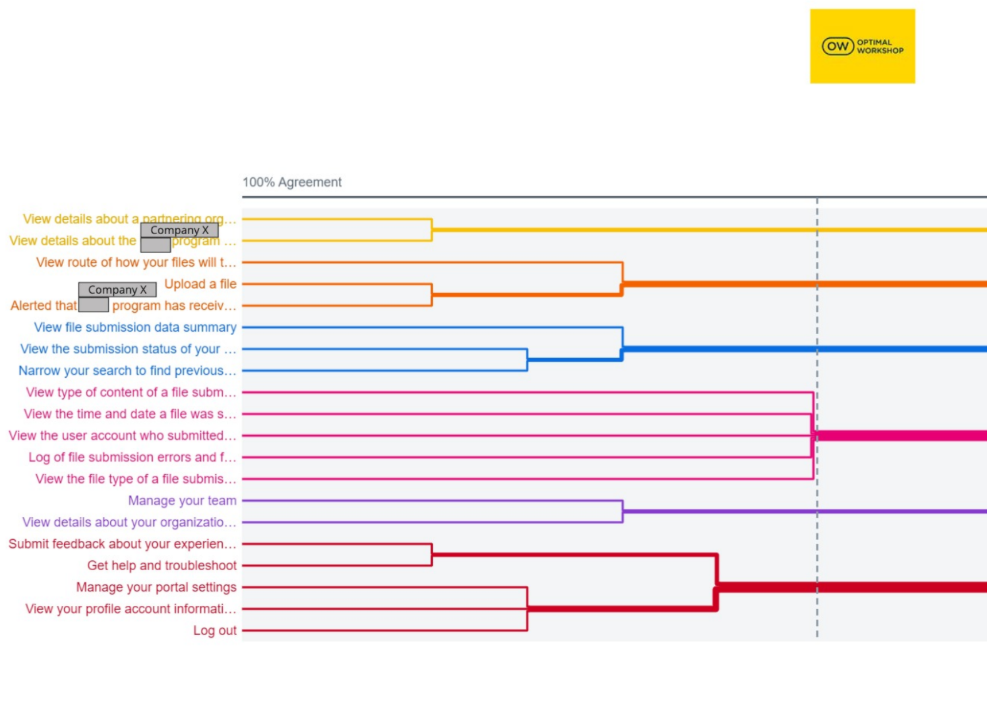
I observed the findings via similarity matrix, dendrogram, 3D clustering, and participant-centric analysis. I synthesized the results from each to create a recommended information architecture.
I also synthesized the use case interview results to identify themes to give context of users’ experiences and pain points and how they impact their suggestions within the card sort.
Takeaways
The recommended pages were:
“File Submissions”
Log of file submission errors and files that need your attention
View the submission status of your file submissions
Narrow your search to find previously submitted files
View the time and date a file was submitted
“Upload”
Upload a file
Alerted that Portal Company Program has received your file
View route of how your files will travel to the Portal Company
“Your Profile Settings”
Manage your portal settings
Manage your team
View details about your organization
View your profile account information
Get help and troubleshoot
Log out
Submit feedback about your experience
“Partner Details”
View details about a partnering organization or team you work with to send files to the CDC
View details about the Portal Company Program you are sending your files to
“Feedback”
Submit feedback about your experience
Conclusion
Data from this study was used to create the headers and pages and much of the information architecture of the initial version of the Portal.
Unfortunately, the Portal was significantly changed due to consolidation efforts for the CDC’s modernization initiatives. Insights from this study however indirectly influence a current data sending application.


